

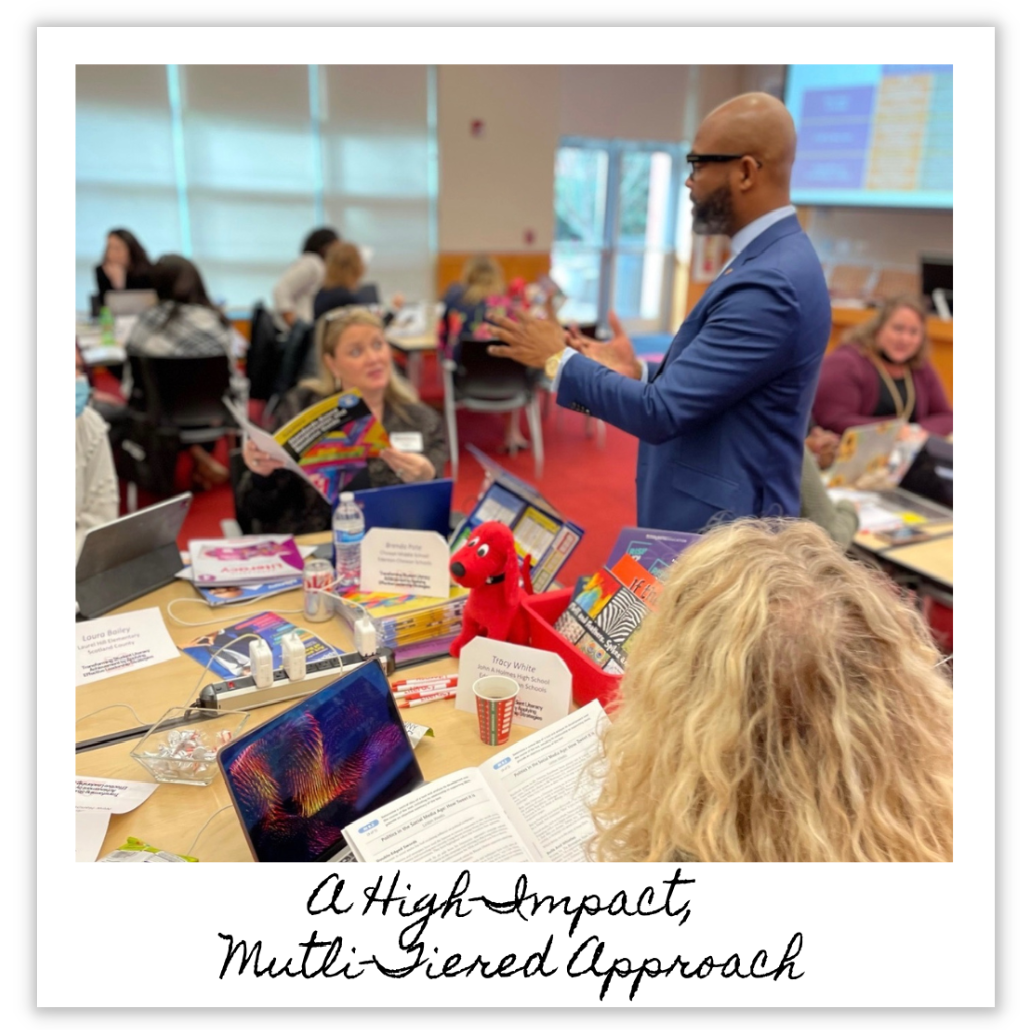
I had the privilege of working with Dr. Dickey as a partner to our district in supporting our instructional vision. Dr. Dickey worked with the Brooklyn North High Schools district for two years. During this time, Dr. Dickey’s dynamic and interactive presentations and workshops captivated our school leaders and educators to embrace a learning stance to examine their goals around ensuring rigorous standards-aligned and purposeful lessons in support of student success.”
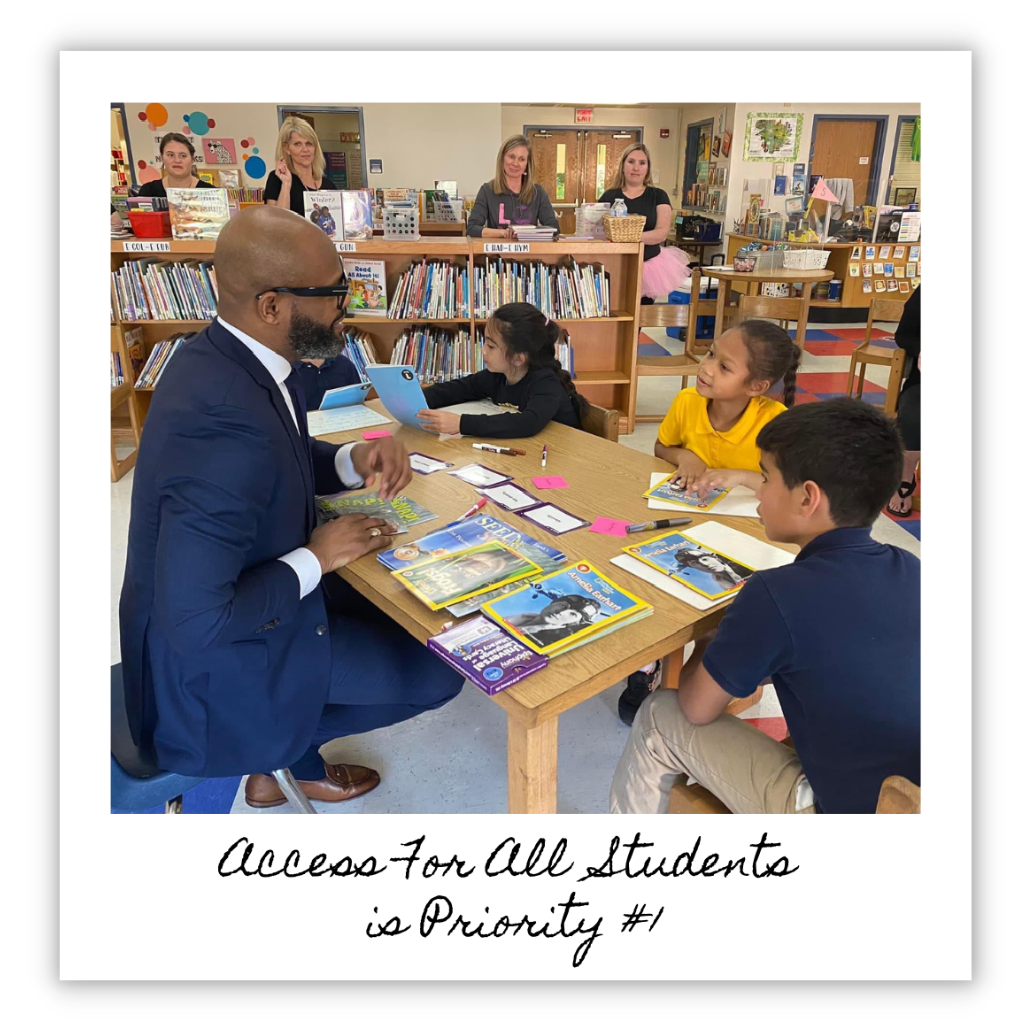
The power of Dr. Dickey’s work has the potential to be far-reaching in our district. He is systematically energizing MHS staff to increase student access to standards-based learning through his academic language development across all content areas. His educational model is effective, comprehensive, and presents manageable strategies teachers can immediately use in the best interest of each student."
Thank you @rucoschools for having @DonyalID as the Keynote Speaker this morning! Always mind-blowing!!!"
Dr. Dickey, thank you so much for sharing your message with AL educators!”
So excited my friend @DonyalID is @EngageNISD!!! Make sure you visit him!!!!”